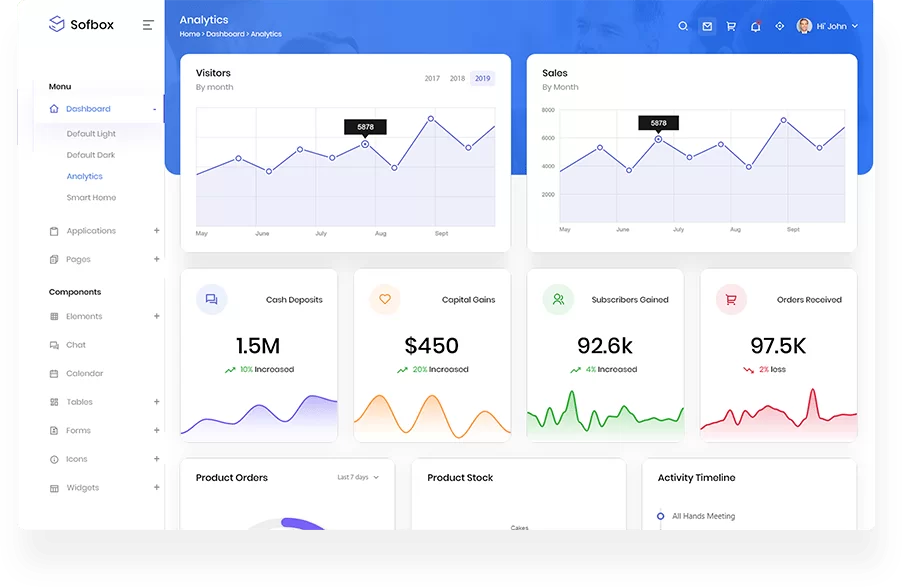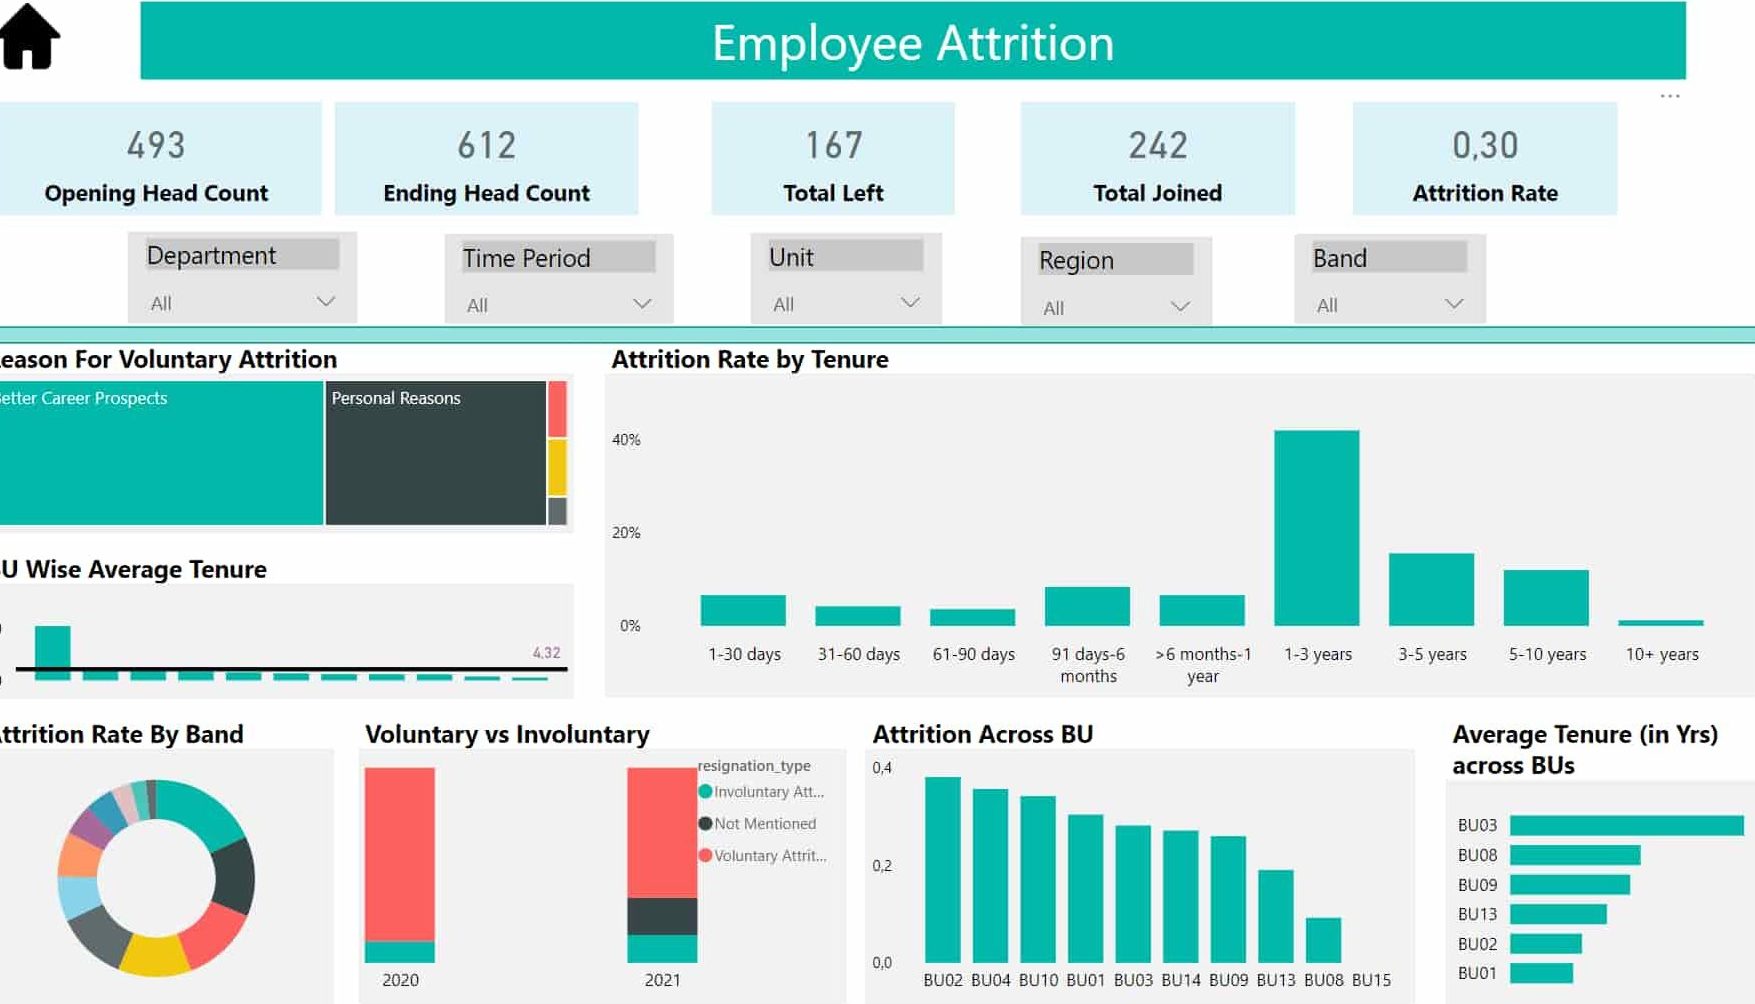

Revenue dashboards are often used by Executives, board members, and financial managers to track the money across numerous departments for different timelines. These dashboards help executives to make meaningful decisions and have a deeper understanding of their budgeted money in the pipeline. We have provided a dashboard to analyze your revenue across various regions and business units in this dashboard.

A one-stop dashboard for HRs to

Turn massive data sets into business insights which can have a major positive impact on your organization.
Allowing users to explore visual data analysis from within whatever websites, portals, apps and business processes they use to make decisions.
Discover hidden relationships and patterns in the data without relying on help from IT.


© 2024 Inference Labs Private Limited
[vc_row][vc_column][vc_raw_html]JTNDJTIxLS0lMjBDYWxlbmRseSUyMGlubGluZSUyMHdpZGdldCUyMGJlZ2luJTIwLS0lM0UlMEElM0NkaXYlMjBjbGFzcyUzRCUyMmNhbGVuZGx5LWlubGluZS13aWRnZXQlMjIlMjBkYXRhLXVybCUzRCUyMmh0dHBzJTNBJTJGJTJGY2FsZW5kbHkuY29tJTJGaW5mZXJlbmNlJTJGZGlzY292ZXJ5JTNGaGlkZV9sYW5kaW5nX3BhZ2VfZGV0YWlscyUzRDElMjZoaWRlX2dkcHJfYmFubmVyJTNEMSUyMiUyMHN0eWxlJTNEJTIybWluLXdpZHRoJTNBMzIwcHglM0JoZWlnaHQlM0E2MzBweCUzQiUyMiUzRSUzQyUyRmRpdiUzRSUwQSUzQ3NjcmlwdCUyMHR5cGUlM0QlMjJ0ZXh0JTJGamF2YXNjcmlwdCUyMiUyMHNyYyUzRCUyMmh0dHBzJTNBJTJGJTJGYXNzZXRzLmNhbGVuZGx5LmNvbSUyRmFzc2V0cyUyRmV4dGVybmFsJTJGd2lkZ2V0LmpzJTIyJTIwYXN5bmMlM0UlM0MlMkZzY3JpcHQlM0UlMEElM0MlMjEtLSUyMENhbGVuZGx5JTIwaW5saW5lJTIwd2lkZ2V0JTIwZW5kJTIwLS0lM0U=[/vc_raw_html][/vc_column][/vc_row]