Nowadays, data storytelling is the essence of creating a successful business. Business users and stakeholders often do not get insights from the raw data, in the way they need them and must take the help of analysts to understand the data.
Many of us ponder over the question of why data storytelling is important to businesses. The most precise and logical answer to this would be to maximize the potential data has to offer. Most companies in the world have found the need to democratize data throughout their business.
The goal of data storytelling is to make it easy for anyone in the organization to access the key metrics that they need to make a calculated & insightful decision that will positively affect their business & help it grow manifold.
Tableau is one of the powerful Business Intelligence tools that help businesses perform high-level data analysis. It helps in visualizing data using various charts & graphs, in addition to creating reports & dashboards to derive meaningful insights. It can connect to all the data sources which are widely used. Tableau’s native connectors can connect to the following data sources:
- File Systems such as CSV, Excel, etc.
- Relational Systems such as Oracle, SQL Server, DB2, etc.
- Cloud Systems such as Windows Azure, Google Big Query, etc.
- Other Sources use ODBC (Open Database Connectivity) which requires installing specific connectors for the required data source.
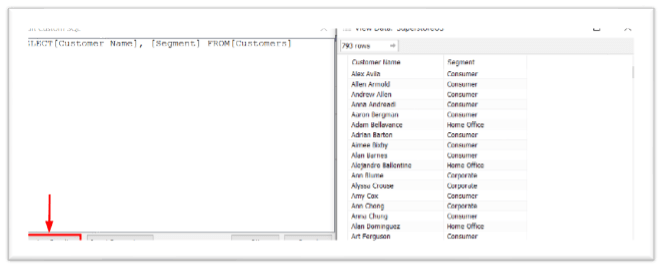
One of the most noteworthy features of Tableau is the built-in ability to write SQL queries to extract specific data from the connected source. Here is a step-by-step process of retrieving data via custom query.
- After loading the data source, click on the “New Custom SQL” button
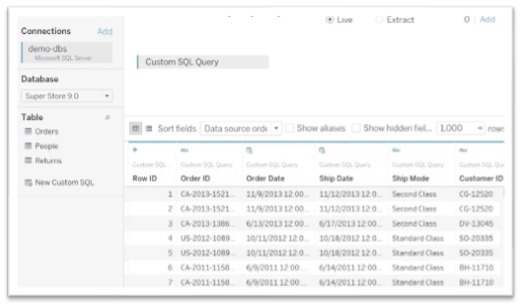
2. Type or paste the query into the text box. The query must be a single SELECT* statement.
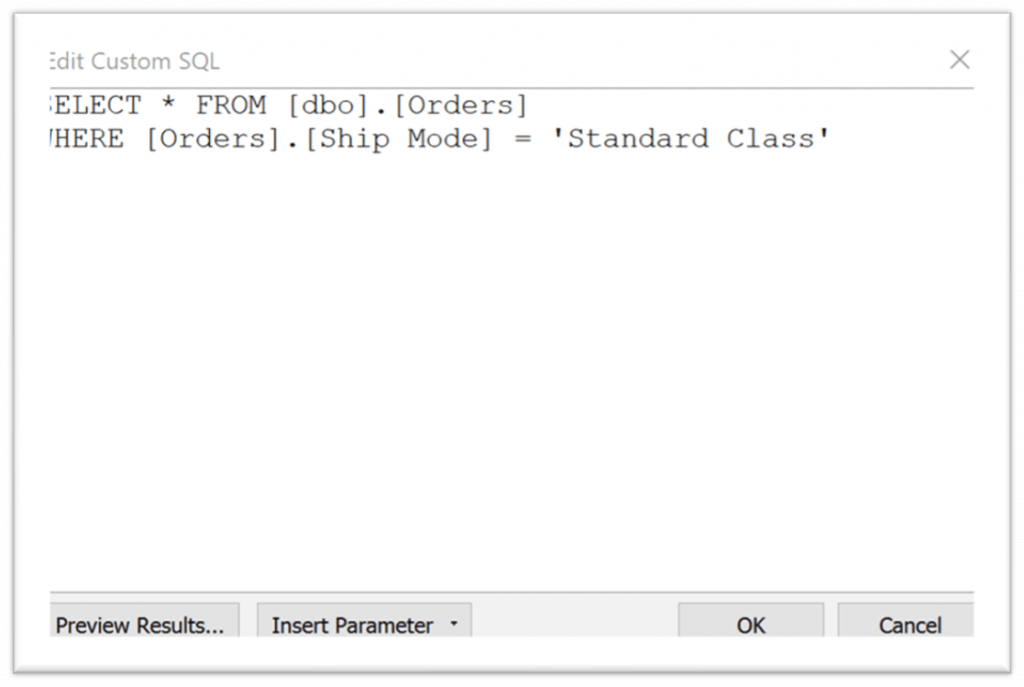
3. User can click on the “Preview Results” button to get a layout of the extracted data through the SQL query before it is applied permanently.
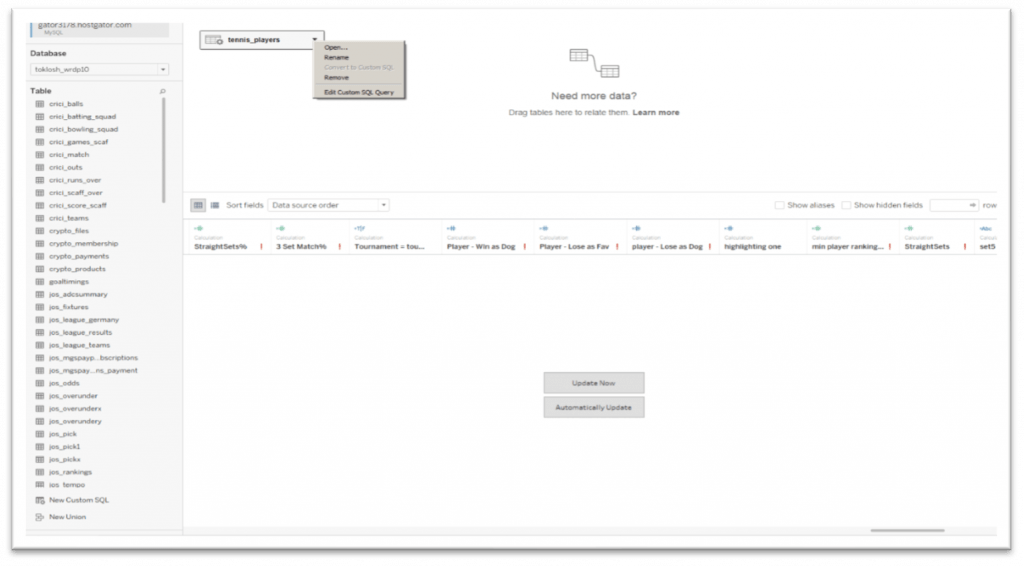
4. The query created will be named “Custom SQL Query”. The user can right-click on the data source & can access the options to open, rename, remove, or edit the query.
5. When finished, click “Ok” & the desired table will be extracted for further analysis
Why is a list view needed? Who uses it? In what scenarios?
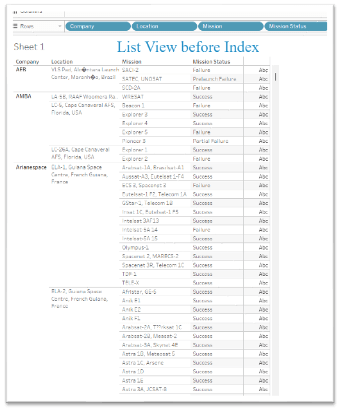
A list view in Tableau is a linear representation of all the fields present in the data source in a tabular format.
The list view in Tableau helps the user to get an idea of the entire data & make specific decisions based on several filters present in the data. For example, if the user has created a list view on sales data, then he/she will be able to perform a detailed view & analysis of the entire data i.e., what should be the total price of a specific product bought by a particular group of customers on a specific date or maybe in a specific geographic location.
Hence, in short, a list view helps the user to make well-informed decisions by seeing the data in a linear & tabular format to get a correct representation of how the data fields are connected & affecting each other.
How to create a list view in Tableau?
After loading the data source in Tableau, to create a list view all we need is to go to a sheet (default Sheet 1) and drag the required columns in the “Rows” section.
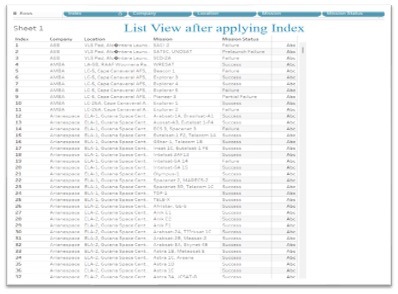
Note: Sometimes the list view may not give the desired layout due to the grouped data, so it is advisable to create an “Index” column as a calculated field and keep that at the first position.
How to publish this report?
After successfully creating a dashboard, it is mandatory to publish it on Tableau Server to make it accessible to others.
To publish a workbook, click on Server > Publish Workbook, or alternatively, the user can click on the share button on the taskbar.
A dialogue box will appear which will ask the user to sign into the Tableau Server & consecutively the dashboard will get published.
The user can access the dashboard anytime by logging in Tableau
